
A Valuation-Aware, Scenario-Based Capital Markets Outlook Mid-Year 2026 Update
Implications for Portfolio Construction, Retirement Income, and Sequence-of-Returns Risk Using a Forward-Looking 10-Year Time Horizon
June 22, 2026
by Chris Brown, Ph.D., CFP® and Ron A. Rhoades, JD, CFP®
Executive Summary
This report updates our Year-End 2025 Capital Markets Outlook (Rhoades & Brown, 2025) through mid-June 2026. In the intervening months, global equities have extended a historic, multi-year advance, led in 2026 by smaller-capitalization and emerging-market stocks rather than the U.S. mega-caps that dominated the prior decade. Beneath that momentum, however, the central tension we identified at year-end has not eased. Rather, it has intensified: U.S. large-company valuations remain near the highest levels in recorded history, which historically has compressed long-term forward returns and elevated sequence-of-returns risk for investors at or near retirement (Campbell & Shiller, 1988; Shiller, 2015).
As fiduciary advisers, our obligation is to look past short-term enthusiasm to the mathematics that govern long-term outcomes: starting valuations and the order in which returns arrive. The key conclusions of this update are:
- U.S. equities remain meaningfully overvalued. The Shiller CAPE ratio sits at approximately 42 as of the date of this publication. This is the second-highest reading in its 145-year history, exceeded only by the December 1999 peak – and is corroborated by elevated price-to-sales and price-to-book ratios (Multpl, 2026a, 2026b, 2026c).
- Long-term return projections remain muted. Vanguard’s Capital Markets Model raised its 10-year U.S. equity outlook by roughly one percentage point in its first-quarter 2026 update as valuations eased modestly, yet still places U.S. equities well above fair value (Vanguard, 2025, 2026).
- Some of the most sophisticated value investors are holding cash. Following Warren Buffett’s retirement as CEO at year-end 2025, Berkshire Hathaway entered 2026 holding a record $397.4 billion in cash and short-term Treasury bills – about 31.7% of total assets (Berkshire Hathaway, 2026; Macrotrends, 2026).
- Sequence-of-returns risk is elevated for near-term retirees. High valuations reduce the margin for error and magnify the damage of an early-retirement drawdown (Pfau & Kitces, 2014).
- Structural defenses – rising equity glidepaths and bond tents, valuation-aware withdrawals, and six-factor diversification – remain the most reliable response to a high-valuation regime, as they were during the 2000–2009 “lost decade” (Pfau & Kitces, 2014; Fama & French, 2018; Dimensional Fund Advisors, 2020).
All return figures herein are forward-looking estimates derived from third-party models and historical relationships, not predictions or guarantees. Actual outcomes may differ materially. This report is educational and does not constitute individualized investment, tax, or legal advice.
Part I: The Early-2026 Run-Up and the Valuation Backdrop
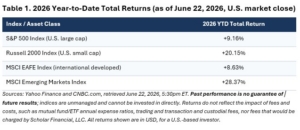
The first half of 2026 has extended the equity advance that produced three consecutive years of double-digit U.S. large-cap gains through 2025. Notably, leadership has broadened: through mid-June 2026, smaller-capitalization and emerging-market equities have substantially outpaced U.S. large caps – a reversal of the prior decade’s pattern, and a reminder that concentrated leadership can rotate quickly.
Valuations Remain Near Historic Extremes
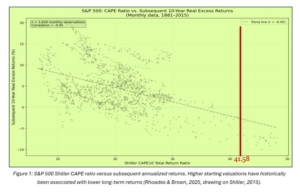
Understanding starting valuations is essential to setting realistic expectations. Valuations are weak short-term timing signals but powerful predictors of long-term returns over 10- to 20-year horizons (Campbell & Shiller, 1988; Shiller, 2015). On that score, little has improved since year-end for the S&P 500 Index – an index of U.S. large company stocks that covers about 80% of available market capitalization (S&P Global):
- Shiller CAPE ratio: approximately 41.58 as of June 22, 2026 (Multpl, 2026a). That is more than double the long-run median of roughly 16–17 (since 1870), above the median of approximately 34.4 for a more recent period of over 25 years (from January 2000 to June 2026), and the second-highest reading since 1881, and not far below the all-time record of 44.2 set in December 1999.
- Price-to-sales ratio: approximately 3.68x, more than double the long-term median of about 1.64x from 2001 through mid-2026 (Multpl, 2026b).
- Price-to-book ratio: approximately 5.92x as of June 22, 2026, nearly double the long-term mean of about 3.2x from 2000 through mid-2026 (Multpl, 2026c).
These measures tell a consistent story: U.S. large-company equities are priced at a substantial premium to the long-run relationship between price and underlying fundamentals. As Shiller’s 130-plus years of data show, elevated CAPE readings have historically been followed by below-average long-term returns, while low readings have preceded above-average returns (Shiller, 2015).
Part II: Long-Term Return Projections
A central source of confusion is the gap between strong recent momentum and muted intermediate-term model projections. Vanguard’s 2026 outlook – aptly subtitled “economic upside, stock-market downside” – captures the paradox: even a credible AI-led productivity boom does not rescue forward returns when the entry price is high (Vanguard, 2025).
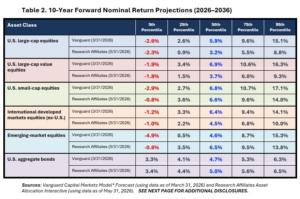
In its first-quarter 2026 update, the Vanguard Capital Markets Model (VCMM) raised its 10-year U.S. equity outlook by about one percentage point as valuations eased modestly during early-year volatility – lifting the U.S. large-cap range to roughly 4.5%–6.5% nominal from the 3.5%–5.5% projected in late 2025 – while still judging U.S. equities to be well above long-term fair value (Vanguard, 2025, 2026).
The table below summarizes valuation-aware 10-year projections drawn from Vanguard and Research Affiliates. The 50th percentile represents the expected 10-year return, although – as shown – the range of returns is quite broad (and extreme returns could be less or more than shown).
Additional Disclosures
Projections are probabilistic model outputs, not guarantees; actual results may well be materially higher or lower; the potential range of returns is broader than as set forth in the chart above. Returns set forth are for asset classes, and do not reflect the fees and costs imposed by mutual funds/ETFs, transaction costs, opportunity costs, nor the fees and costs charged by Scholar Financial, LLC and by any custodian.
Additional Disclosures for Vanguard: The projections and other information generated by the VCMM regarding the likelihood of various investment outcomes are hypothetical in nature, do not reflect actual investment results, and are not guarantees of future results. Distribution of return outcomes from VCMM are derived from 10,000 simulations for each modeled asset class. Simulations are as of March 31, 2026. Results from the model may vary with each use and over time. The asset-return distributions shown here are in nominal terms—meaning they do not account for inflation, taxes, or investment expenses—and represent Vanguard’s views of likely total returns, in U.S. dollar terms, over the next 10 or 30 years; such forecasts are not intended to be extrapolated into short-term outlooks. Vanguard’s forecasts are generated by the VCMM and reflect the collective perspective of our Investment Strategy Group. Expected returns and median volatility or risk levels—and the uncertainty surrounding them—are among a number of qualitative and quantitative inputs used in Vanguard’s investment methodology and portfolio construction process. Volatility is represented by the standard deviation of returns.
The VCMM projections are based on a statistical analysis of historical data. Future returns may behave differently from the historical patterns captured in the VCMM. More importantly, the VCMM may be underestimating extreme negative scenarios unobserved in the historical period on which the model estimation is based. The theoretical and empirical foundation for the Vanguard Capital Markets Model is that the returns of various asset classes reflect the compensation investors require for bearing different types of systematic risk (beta). At the core of the model are estimates of the dynamic statistical relationship between risk factors and asset returns, obtained from statistical analysis based on available monthly financial and economic data from as early as 1960. Using a system of estimated equations, the model then applies a Monte Carlo simulation method to project the estimated interrelationships among risk factors and asset classes as well as uncertainty and randomness over time. The model generates a large set of simulated outcomes for each asset class over time. Forecasts represent the distribution of geometric returns over different time horizons. Results produced by the tool will vary with each use and over time.
The VCMM’s primary value is its utility in analyzing potential investor portfolios. VCMM asset-class forecasts—comprising distributions of expected returns, volatilities, and correlations—are key to the evaluation of potential downside risks, risk-return trade-offs, and the diversification benefits of various asset classes. Although central tendencies are generated in any return distribution, Vanguard stresses that focusing on the full range of potential outcomes for the assets considered is the most effective way to use VCMM output.
The VCMM seeks to represent the uncertainty inherent in forecasting by generating a wide range of potential outcomes. The VCMM does not impose “normality” on expected return distributions but rather is influenced by the so-called fat tails and skewness of modeled asset-class returns. Within the range of outcomes, individual experiences can be quite different, underscoring the varied nature of potential investment outcomes. Indeed, this is a key reason why we approach asset-return outlooks in a distributional framework.
For additional information, including information on asset classes and their representative indexes as utilized by Vanguard, please see: https://corporate.vanguard.com/content/corporatesite/us/en/corp/vemo/vemo-return-forecasts.html.
Additional Disclosures for Research Affiliates Data: The Asset Allocation Interactive Tool generates outcomes that are hypothetical in nature and does not recommend securities. Results may vary with each use and over time. The performance information presented represents simulated performance. Past simulated performance is no guarantee of future performance and does not represent actual performance of an investment product; actual investment results will differ. For more information on the methodology utilized, please see: https://www.researchaffiliates.com/content/dam/ra/documents/asset-allocation/aai-methodology-0326.pdf.
Differences in the projections of various investment outcomes for the same asset class shown, as between Vanguard and Research Affiliates, are attributable to a range of factors, including but not limited to different dates utilized as starting points, different indexes or constructions utilized to represent the various asset classes, differences in projections of inflation and other economic developments, and many more.
The structural takeaway is unchanged from year-end: expected returns are now driven more by valuation differentials than by asset-class labels. Bonds again compete meaningfully with equities on a forward real-return basis, and non-U.S. and value-oriented equities carry higher expected returns because of lower starting valuations (Vanguard, 2025).
Part III: Exceptional Times –
The 2000 Parallel and Berkshire’s Record Cash
We remain firmly opposed to market timing. Decades of evidence show that exiting markets on valuation signals is behaviorally and financially destructive, given trading frictions, taxes, and the risk of missing strong upside. Yet we would be remiss not to note that today’s regime is exceptional. The market’s concentration in a handful of mega-cap names, and a narrative-driven enthusiasm for artificial intelligence, rhyme closely with the late-1990s internet build-out that preceded the 2000–2009 “lost decade.”
One broad gauge underscores the point. The ratio of total U.S. market capitalization to GDP – the “Buffett Indicator” – stood at approximately 214% as of June 22, 2026 (per https://thebuffettindicator.com/), well above its long-term average near 165% and close to an all-time high (GuruFocus, 2026). In a 2001 essay, Warren Buffett observed that when this ratio “approaches 200% – as it did in 1999 and a part of 2000 – you are playing with fire” (Buffett & Loomis, 2001).
The behavior of disciplined value investors is instructive. Following Buffett’s retirement as chief executive at the end of 2025 – with Greg Abel assuming the CEO role on January 1, 2026 while Buffett remained chairman – Berkshire Hathaway entered the year with the largest cash position in its history (CNBC, 2026). As of March 31, 2026, Berkshire held a record $397.4 billion in cash, cash equivalents, and short-term U.S. Treasury bills – the large majority of it in Treasury bills – equal to roughly 31.7% of its $1.25 trillion in total assets (Berkshire Hathaway, 2026; Macrotrends, 2026).
“Three times since I’ve taken over Berkshire, it’s gone down more than 50%. This is nothing.” Asked when Berkshire would deploy its cash, Buffett indicated it was not yet an ideal environment for putting money to work, and that the moment would come when “nobody else will answer their phones.” – Warren Buffett, spring 2026 (The Motley Fool, 2026).
We do not present this as a call to hoard cash; most investors are not positioned to deploy opportunistically at Berkshire’s scale, and being out of the market carries its own substantial risks. Rather, it illustrates a fiduciary mindset: when prices leave little margin of safety, patience and discipline – not abandonment of a plan – are the appropriate responses.
Part IV: Sequence-of-Returns Risk and Structural Guardrails
For investors at or near retirement, the combination of high valuations and extended momentum elevates sequence-of-returns risk – the danger that the order of returns, not merely their average, determines portfolio survival. When withdrawals begin near a valuation peak, an early drawdown can permanently impair a portfolio, because fewer assets remain to participate in any subsequent recovery (Pfau & Kitces, 2014). Research suggests that roughly the first decade of retirement returns explains the large majority of final outcomes. Three structural defenses are central to our framework.
- Rising Equity Glidepaths and the Bond Tent
Conventional advice steadily reduces equity exposure throughout retirement, which maximizes risk exposure precisely when the portfolio is largest and withdrawals begin. Kitces and Pfau demonstrated the counterintuitive alternative: entering retirement relatively conservative (for example, 30%–40% equities) and gradually raising equity exposure toward 60%–70% over the first 10–15 years reduces both the probability and the magnitude of failure in adverse scenarios (Pfau & Kitces, 2014). The complementary “bond tent” builds a reserve of short-duration, high-quality fixed income approaching retirement and spends it down through the early, most vulnerable years – sheltering the portfolio during the “retirement danger zone.”
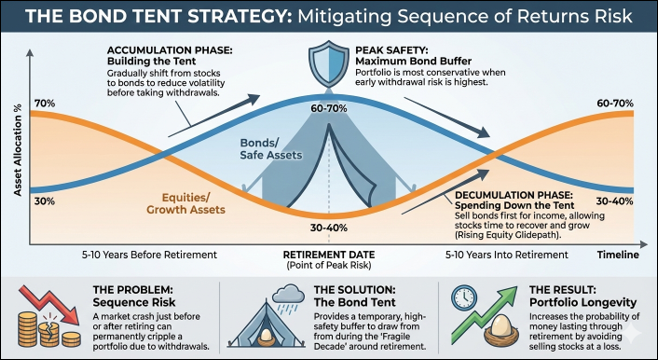
Figure 2. The bond-tent / rising-equity-glidepath strategy: fixed income rises into retirement, then is spent down as equity exposure rises again once early-retirement sequence risk recedes (Rhoades & Brown, 2025; Pfau & Kitces, 2014).
- Valuation-Aware Dynamic Withdrawals
Static “4% rule” spending was derived as a worst-case historical floor, not an optimal rule for all valuation regimes (Bengen, 1994). Dynamic strategies – Guyton-Klinger guardrails or CAPE-based spending adjustments – improve durability by trimming spending after market declines and allowing increases after gains (Guyton & Klinger, 2006). Given today’s elevated CAPE, Morningstar’s 2025 research places the highest safe starting rate for fixed, inflation-adjusted spending (90% success over 30 years) at about 3.7%–3.9%, and a valuation-aware initial rate near 3.0%–3.5% is consistent with current conditions for younger retirees facing long horizons (Arnott, Benz, Kephart, & Guo, 2025).
- Six-Factor Diversification (see Part V)
Tilting equities toward dimensionally verified risk premiums – value, smaller size, and high profitability, with attention to investment and momentum – has historically reduced exposure to the most expensive market segments and cushioned high-valuation unwinds (Fama & French, 2018).
Part V: The Fama-French Six-Factor Model as Risk Management
Factor investing is often mischaracterized as merely return-seeking. Thoughtfully applied, factor tilts are risk-management tools that reduce concentration in the most richly valued stocks. The academic foundation is the work of Eugene Fama and Kenneth French, whose three-factor model (1993) added size and value to market beta; whose five-factor model (2015) added profitability and investment; and whose six-factor model (2018) incorporates momentum – the factor first documented by Carhart (1997) – as a sixth dimension (Fama & French, 1993, 2015, 2018; Carhart, 1997).
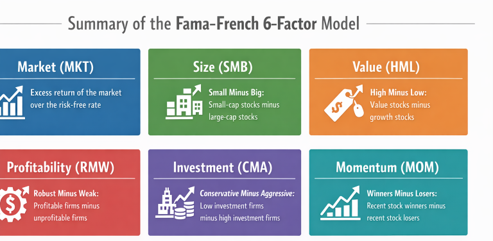
Figure 3. The Fama-French six-factor framework: market (MKT), size (SMB), value (HML), profitability (RMW), investment (CMA), and momentum (MOM/UMD) (Rhoades & Brown, 2025, drawing on Fama & French, 2018; Carhart, 1997).
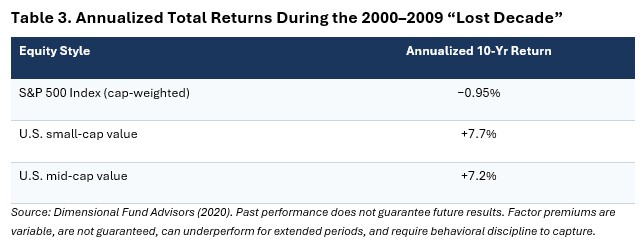
The diversification rationale is that these factors capture distinct sources of systematic risk and return; spreading exposure across them – rather than concentrating in growth-oriented mega-caps – reduces dependence on any single driver. The 2000–2009 decade is the cautionary precedent. After the late-1990s growth peak, the cap-weighted S&P 500 delivered a slightly negative annualized return, while value- and size-tilted equities – cheap at the start of the period – produced strong positive returns (Dimensional Fund Advisors, 2020).
Part VI: A Fiduciary Framework for the Current Regime
No forecaster can map the precise path of the next decade. Our task is not to predict the unpredictable but to build portfolios resilient across many plausible futures. Three pillars structure that resilience.
- Valuation-aware spending. Rather than anchor on a fixed 4% real withdrawal, new retirees should consider a lower initial rate (roughly 3.0%–3.5%) given high starting valuations, or adopt risk-based guardrails that adjust spending dynamically (Arnott et al., 2025; Guyton & Klinger, 2006).
- Time-segmented (“bucket”) structure. Hold 1–2 years of spending needs in cash (Bucket 1), 3–10 years in high-quality bonds (Bucket 2), and the long-term remainder in globally diversified, factor-tilted equities (Bucket 3) – combined with disciplined, total-return rebalancing.
- Disciplined rebalancing. Systematically trim appreciated asset classes during exuberant markets and add to laggards, enforcing “buy low, sell high” rather than chasing momentum.
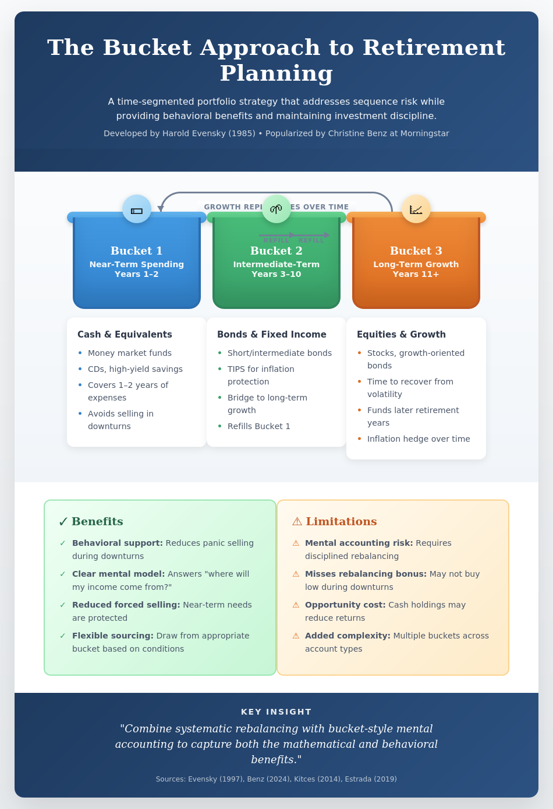
Figure 4. The three-bucket retirement-income framework, pairing near-term safety with long-term, factor-diversified growth (Rhoades & Brown, 2025).
Through rising equity glidepaths, valuation-aware withdrawals, six-factor diversification, and disciplined rebalancing, investors can pursue financial independence across a wide range of outcomes – without betting the plan on any single forecast. As we wrote at year-end, our responsibility as advisers is not to predict the unpredictable, but to prepare our clients for whatever the future may hold.
About the Authors
Dr. Ron A. Rhoades, JD, CFP® is Associate Professor of Finance and Co-Director of the Personal Financial Planning Program at Western Kentucky University, recipient of the Frankel Fiduciary Prize (2020), and author of Mastering the Science and Art of Investing.
Dr. Chris Brown, Ph.D., CFP® is Professor of Finance, Endowed Fellow, and Chair of the Department of Finance at Western Kentucky University. Scholar Financial is a fee-only, fiduciary practice within XY Investment Solutions, LLC.
Contact: AdvisorInfo@ScholarFinancial.com.
Disclosures: The opinions expressed are solely those of the authors and do not necessarily reflect the views of XY Investment Solutions, LLC (XYIS). They are based on information available at the time of writing and are subject to change without notice. While believed reliable, the information has not been independently verified by XYIS, and no guarantee is provided as to its accuracy or completeness. Nothing herein is investment, tax, or legal advice, or a recommendation to buy or sell any security. Past performance does not guarantee future results; all investments involve risk, including possible loss of principal. Forward-looking return estimates are model-based and probabilistic. Factor premiums are not guaranteed and may not persist. Consult a qualified professional before making investment decisions.
Sources
Arnott, A. C., Benz, C., Kephart, J., & Guo, T. (2025). The state of retirement income: 2025. Morningstar. https://www.morningstar.com/retirement
Bengen, W. P. (1994). Determining withdrawal rates using historical data. Journal of Financial Planning, 7(4), 171–180.
Berkshire Hathaway Inc. (2026). Form 10-Q for the quarterly period ended March 31, 2026. U.S. Securities and Exchange Commission. https://www.sec.gov/Archives/edgar/data/0001067983/000119312526202243/brka-20260331.htm
Buffett, W. E., & Loomis, C. J. (2001, December 10). Warren Buffett on the stock market. Fortune.
Campbell, J. Y., & Shiller, R. J. (1988). Stock prices, earnings, and expected dividends. The Journal of Finance, 43(3), 661–676.
Carhart, M. M. (1997). On persistence in mutual fund performance. The Journal of Finance, 52(1), 57–82.
CNBC. (2026, January 1). Warren Buffett retires as Berkshire Hathaway CEO. https://www.cnbc.com/2026/01/01/warren-buffett-retires-as-berkshire-hathaway-ceo.html
Dimensional Fund Advisors. (2020). A tale of two decades: Lessons for long-term investors. Dimensional Insights. https://www.dimensional.com/
Fama, E. F., & French, K. R. (1993). Common risk factors in the returns on stocks and bonds. Journal of Financial Economics, 33(1), 3–56.
Fama, E. F., & French, K. R. (2015). A five-factor asset pricing model. Journal of Financial Economics, 116(1), 1–22.
Fama, E. F., & French, K. R. (2018). Choosing factors. Journal of Financial Economics, 128(2), 234–252.
GuruFocus. (2026). Ratio of total U.S. market capitalization over GDP (Buffett Indicator). Retrieved June 2026, from https://www.gurufocus.com/economic_indicators/4602/usa-ratio-of-total-market-cap-over-gdp
Guyton, J. T., & Klinger, W. J. (2006). Decision rules and maximum initial withdrawal rates. Journal of Financial Planning, 19(3), 49–57.
J.P. Morgan Asset Management. (2026). Weekly market recap (data through June 12, 2026). https://am.jpmorgan.com/
Macrotrends. (2026). Berkshire Hathaway total assets 2012–2026. https://www.macrotrends.net/stocks/charts/BRK.B/berkshire-hathaway/total-assets
The Motley Fool. (2026, June 8). Warren Buffett says the 2026 pullback wasn’t big enough to move Berkshire’s cash. https://www.fool.com/investing/2026/06/08/warren-buffett-2026-pullback-wasnt-big-berkshire/
Multpl. (2026a). Shiller PE ratio. Retrieved June 18, 2026, from https://www.multpl.com/shiller-pe
Multpl. (2026b). S&P 500 price to sales ratio. Retrieved June 2026, from https://www.multpl.com/s-p-500-price-to-sales
Multpl. (2026c). S&P 500 price to book value. Retrieved June 16, 2026, from https://www.multpl.com/s-p-500-price-to-book
Pfau, W. D., & Kitces, M. E. (2014). Reducing retirement risk with a rising equity glide path. Journal of Financial Planning, 27(1), 38–45.
Research Affiliates. (2025). Asset allocation interactive. Research Affiliates, LLC. https://interactive.researchaffiliates.com/
Rhoades, R. A., & Brown, C. (2025, December 31). A valuation-aware, scenario-based capital markets outlook: Year-end 2025. Scholar Financial, LLC.
S&P Global. 2026. Providing information on the S&P 500® Index.
Shiller, R. J. (2015). Irrational exuberance (3rd ed.). Princeton University Press.
Vanguard Group. (2025, December). Vanguard economic and market outlook for 2026: AI exuberance – Economic upside, stock market downside. Vanguard Investment Strategy Group. https://corporate.vanguard.com/
Vanguard Group. (2026). Vanguard Capital Markets Model® forecasts (simulations as of March 31, 2026). https://corporate.vanguard.com/


